Place: DWD Richard-Aßmann-Observatorium at Lindenberg
- There are already many ceilometer available
- Ancillary data:
- Radiosonde 00, 06, 12, 18 UT (can be found in coarse resolution at University of Wyoming with station ID 10393)
- Eye observations hourly (24/7)
- AERONET sun photometer (340-1640 nm)
- Probably: mobile DWD Aerosol lidar (bsc coef at 355+532+1064nm; ext coef at 355+532nm; depolarization at 532 nm)
- In special situations: 355 Raman lidar (aerosol bsc, clouds, depolarization, humidity, temperature)
Period:
- There should be periods with ‘nice weather’ and periods with Saharan dust advection in the free troposphere
- June-August 2015
Organization:
- If possible, there should be at least 2 instruments of every type in order to see instrument-to-instrument variability
- All participating instruments shall provide their standard profiling data and all additional (e.g. housekeeping) data that are provided in standard output. Data shall be as ‘raw’ as possible.
- Daily procedure:
- All instruments send raw data to a data pool (to be provided by DWD)
- DWD generates plots (quicklooks) according to the campaign goals
- Time-height cross section of attenuated backscatter
- Hourly profile comparison of attenuated backscatter profiles
- Hourly profile comparison of signal-to-noise profiles
- Daily comparison of cloud base heights
- Probably house-keeping data
- Plots are published daily (access restricted to participants)
- Option for daily for discussion (e.g. webmeeting) of results and current meteorological situation -> generation of additional plots on request
- About one month after end of campaign: SWG meeting to discuss results and prepare report/publication
- A remote control of instruments from outside of DWD will not be realized
Data policy:
- Measured profile and cloud data are processed (e.g., plotted and normalized) by DWD and provided together with ancillary data to all participants via password protected FTP server.
- Finally, all results shall be published. All participants agree to publish their data with respect to the purpose of this campaign.
- All participants remain the owner of the data delivered by their instrument. If data of the campaign shall be used and published for other studies, the data owners have to be asked for agreement and co-authorship shall be offered
Glossary:
The definition of variables and terms used on this webpage refers to the glossary of E-PROFILE.
Instrument details:
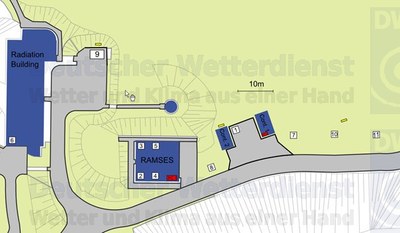
| locations: | |
|---|---|
| near radiation building | at wind profiler site |
 |
 |
| site details: | ||||||
|---|---|---|---|---|---|---|
| Location nb. | Instrument name | Instrument ID | Instrument type | Institution | lat/lon | altitude [m asl] |
| 1 | CHM140101 | 140101 | CHM 15k Nimbus | MOL-RAO | 52.208694 / 14.1225 | 115 |
| 2 | CHX080082 | 080082 | CHX 15k Nimbus | MOL-RAO | 52.208583 / 14.122083 | 120 |
| 3 | CL51RAO | 124350003 | CL51 | MOL-RAO | 52.208583 / 14.122083 | 120 |
| 4 | CL31RAO | 124350004 | CL31 | MOL-RAO | 52.208583 / 14.122083 | 120 |
| 5 | LD40_002 | 002 | LD40 | MOL-RAO | 52.208583 / 14.122083 | 120 |
| 6 | CHXLMU | 090103 | CHX 15k Nimbus | LMU | 52.208667 / 14.121583 | 126 |
| 7 | CL51CG | 141530001 | CL51 | CG | 52.208639 / 14.122694 | 115 |
| 8 | CS2 | 167484 | CS135 | CS | 52.208639 / 14.122694 | 115 |
| 9 | RALPH | PollyXT | MOHP | 52.208861 / 14.121889 | 118 | |
| 10 | CS1 | 167483 | CS135 | CS | 52.208639 / 14.122944 | 115 |
| 11 | CL31RUB | 134550001 | CL31 | RUB | 52.208639 / 14.123139 | 115 |
| 12 | CHM100110 | 100110 | CHM 15k Nimbus | MOL-RAO | 52.209393 / 14.128442 | 101 |
| 13 | LD40_003 | 003 | LD40 | MOL-RAO | 52.208557 / 14.122033 | 101 |
|
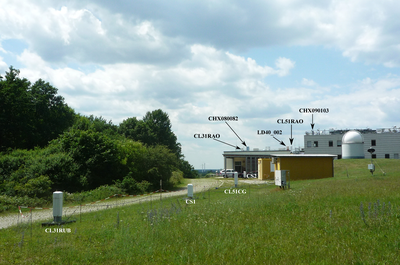
Ceilometer locations at MOL/RAO. The CHM140101 is located between the yellow containers |
|---|
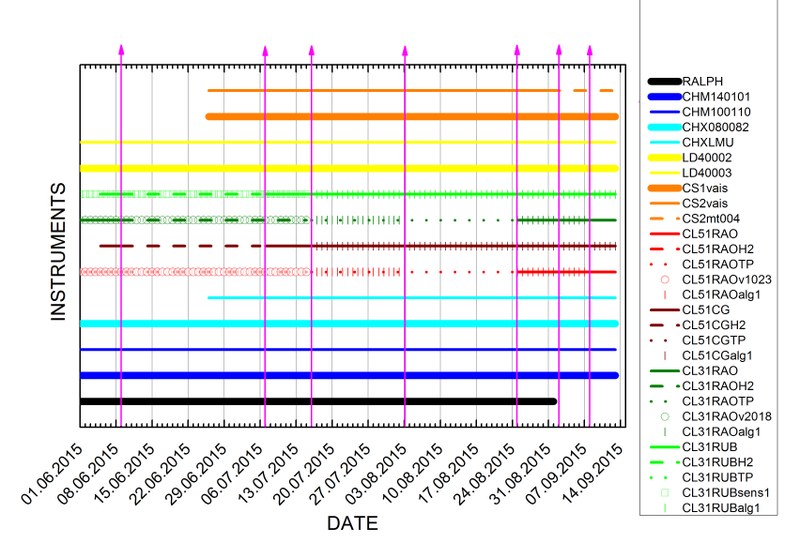
Instrument paramters and firmware versions:
We test different firmware versions and firmware parameter settings. The corresponding time table shows that we organize changes of these settings in a way which ensures comparision between instruments with same settings and comparisons between different parameter settings.


